Imageens

ArtFun+

As seen in

ArtFun+

Hurry, take advantage of our offer for Cardiovascular KOLs.

ArtFun+ is the most clinically validated & published technology for measuring arterial stiffness biomarkers by MRI.

If you are an experienced cardiovascular KOLs, interested in learning more about the medical potential of this software, IMAGEENS is offering a free trial, for a limited time period and a selection of KOLs only.

If you qualify for this offer, fill out the following form and we will be in touch with you shortly:

77

Publications

1510

Citations

4000

Patients used for clinical validation

1,5M

Images used to validate the algorithm

Predictive of death and hard cardiovascular events.

ArtFun+ measure arterial stiffness and flow biomarkers that are commonly recognized as a major risk factor for CV diseases and significant predictors of mortality and hard cardiovascular events.

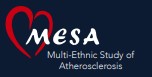
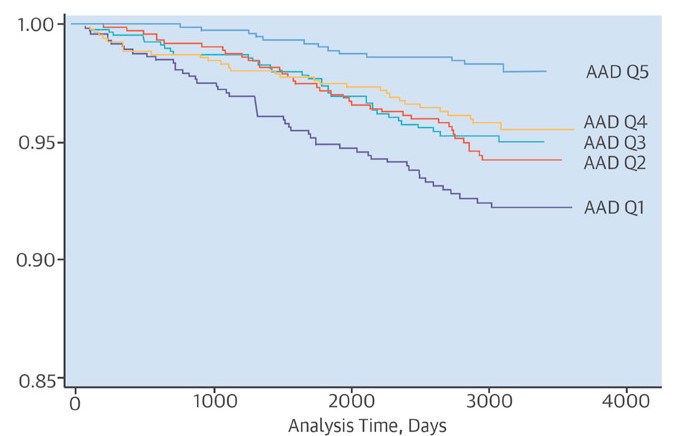
The algorithms of ArtFun+ were used in the NIH-funded MESA trial (Multi-Ethnic Study of Atherosclerosis), which assessed the prognostic capability of the biomarkers measured by ArtFun+.


Example publication: Prognostic value of Ascending Aorta Distensibility (AAD) in the MESA trial.

By measuring the Ascending Aorta Distensibility (AAD) from Phase Contrast (PC) MRIs in a cohort of 3’675 patients, the investigators of the MESA trial showed the predictive power of AAD for both patient survival and hard cardiovascular disease at 8.5 years.

AAD predicted the risk of mortality and hard cardiovascular events 8.5 years in advance – regardless of age. After adjusting for traditional cardiovascular risk s, individuals with a divergence between their distensibility and that of their age group had a two-time (2x) higher risk of death, and a four-fold (4x) higher risk of having a hard cardiovascular event


Redheuil A, Bluemke DA, Lima JAC et. al. Proximal aortic distensibility is an independent predictor of all-cause mortality and incident CV events: the MESA study. J Am Coll Cardiol. 2014 Dec.

Figure 1:
Cumulative event-free probabilities for survival according to quintiles of ascending aorta distensibility (AAD)

Figure 2:
Cumulative event-free probabilities of incident hard cardiovascular disease (CVD) according to quintiles of ascending aorta distensibility (AAD)

"A man is as old as his arteries"

-Thomas Sydenham-

Biomarkers and measurements offered by ArtFun+.

ArtFun+ measures three main biomarkers that are predictive of cardiovascular risk:

  1. Distensibility of the ascending aorta (mmHg-1): The mechanical deformation of the patient’s vessel during the cardiac cycle, providing accurate information about the wall stiffness of the selected arterial section.

  2. Aortic Arch Pulse Wave Velocity (m/s): The speed at which a cardiac pulse wave travels through a segment of the cardiovascular system, indicating the stiffness of the segment (stiff arteries lead to faster propagation of the pulse wave).

  3. Regurgitation (mL/s): Quantification of the blood flow in the opposite of the physiological direction, which has been shown to be a marker of subclinical aortic remodeling and cardiovascular disease.

    These biomarkers complement routine MRI exams with an analysis enabling a personalized prognosis of the cardiovascular health status of patients.

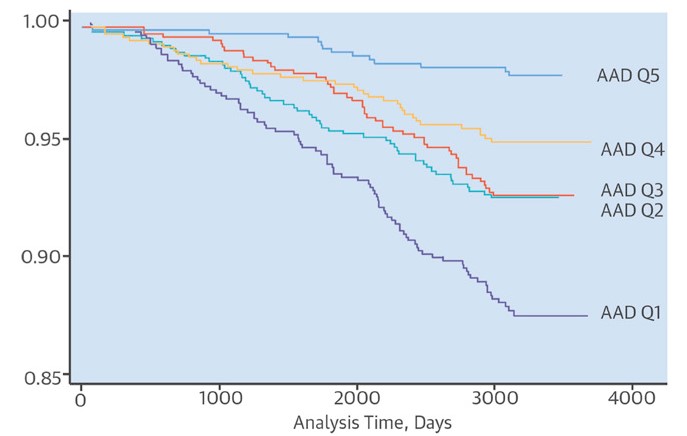
In addition to the leading biomarkers mentioned above, ArtFun+ enalbes a precise quantification multiple other geometrical and flow measurements, including:

  1. Diameter
    • Mean diameter (mm)
    • Min diameter (mm
    • Max diameter (mm)
    • Diameter variation (%)
  1. Area
    • Area (cm2): area delineated by the contour
    • Minimal Area (cm²): minimal area along cardiac cycle
    • Maximal Area (cm²): maximal area along cardiac cycle
    • Positive flow area (cm2): pixellic area represented by positive velocity pixels inside the contour
    • Negative flow area (cm2): pixellic area represented by negative velocity pixels inside the contour
  1. Strain
    • Strain (%): ratio of the difference between max area and min area over min area
  1. Blood Velocity measurements:

Velocity

    • Mean Velocity (cm/s): mean velocity within the segmented vessel
    • Minimum Velocity (cm/s): minimal velocity within the segmented vessel
    • Maximum Velocity (cm/s): maximal velocity within the segmented vessel

Positive Velocity

    • Mean Positive Velocity (cm/s): mean velocity considering only positive velocity pixels (physiological direction of flow) within the segmented vessel
    • Minimum Positive Velocity (cm/s): minimal velocity considering only positive velocity pixels (physiological direction of flow) within the segmented vessel
    • Maximum Positive velocity (cm/s): maximal velocity considering only positive velocity pixels (physiological direction of flow) within the segmented vessel
  • Negative Velocity
    • Mean Negative Velocity (cm/s): mean velocity considering only negative velocity pixels (opposite of the physiological direction of flow) within the vessel
    • Minimum Negative Velocity (cm/s): minimal velocity considering only negative velocity pixels (opposite of the physiological direction of flow) within the vessel
    • Maximum Negative Velocity (cm/s): maximal velocity considering only negative velocity pixels (opposite of the physiological direction of flow) within the vessel
  1. Blood Flow measurements:
    • Flow (mL/s): flow within the segmented vessel
    • Positive flow (mL/s): flow considering only positive velocity pixels (physiological direction of flow) within the segmented vessel
    • Negative flow (mL/s): flow considering only negative velocity pixels (opposite of the physiological direction of flow) within the vessel
    • Flow value at ejection peak (mL/s): maximal encountered flow value
    • Backward Flow at peak (mL/s): idem Flow value at ejection peak, but on negative -flow-only curve
    • Forward Flow at peak (mL/s): idem Flow value at ejection peak, but on positive-flow-only curve
    • Ejection acceleration slope (mL/s2): slope between the ejection start point and ejection peak point
  1. Blood Volumes measurements
    • Acceleration volume (mL): blood volume between the section between the ejection start and the ejection peak
    • Ejection volume (mL): blood volume between the section between the ejection start and the ejection end
    • Regurgitation volume (mL): Negative blood volume between the ejection end and the regurgitation end
    • Net volume (mL): net blood volume during the whole cardiac cycle
    • Regurgitation fraction (%): ratio of the regurgitation volume over the net volume
    • Backward Flow Ejection volume (mL): Ejection volume, but on negative flow components only
    • Forward Flow Ejection volume (mL): Ejection volume, but on positive flow components only
    • Backward Flow Net volume (mL): Net volume, but on negative flow only
    • Forward Flow Net volume (mL): idem Net volume, but on positive flow only
  1. Cardiac events
    • Ejection start (ms): temporal position of the ejection beginning on the net flow curve
    • Ejection peak (ms): temporal position of the ejection peak on net flow curve
    • Ejection end (ms): temporal position of the ejection end on net flow curve
    • Regurgitation end (ms): temporal position of the regurgitation end on net flow curve (if equal to ejection end, then there is no regurgitation)
    • Delay from flow max peak to area max peak (ms): time delay between the ejection peak point (flow curve) and the maximal area point (area curve)
    • Backward Flow Ejection start (ms): Ejection start on negative flow only
    • Forward Flow Ejection start (ms): Ejection start on positive flow only
    • Backward Flow Ejection peak (ms): Ejection peak  on negative flow only
    • Forward Flow Ejection peak (ms): Ejection peak  on positive flow only
    • Backward Flow Ejection end (ms): Ejection end on negative flow only curve
    • Forward Flow Ejection end (ms): Ejection end on positive flow only
    • Temporal % for Minimal Area: moment of cardiac cycle where the minimal area happens, in percent
    • Temporal % for Maximal Area: moment of cardiac cycle where the maximal area happens, in percent
  1. Confidence estimation
    • Confidence estimation for %T_min: qualitative assessment of temporal position of minimal area
    • Confidence estimation for %T_max: qualitative assessment of temporal position of maximal area